"Satellite-based evidence of recent decline in global forest recovery rate from tree mortality events" by Yuchao Yan et al 2025.
Fascinating and educational. All the more for us in Germany and Finland, and likely other Europeans, whose forests morphed from CO2 sink to source. The study ends with 2020 data tho, Europe with 2018.
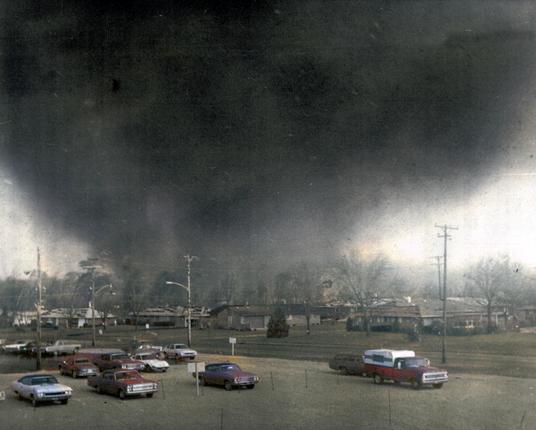
Only non-fire mortality events were analyzed.
I learned how recovery after a drought-driven forest mortality event depends on
 during recovery; not so much the event severity.
https://www.nature.com/articles/s41477-025-01948-4
Free e-pdf provided by one of the authors:
https://rdcu.be/eigV4
Don't know about you but to me, a paper is particularly "good" if I'm left with a host of new pressing questions. "Why did they..? Was it maybe ..? What if it had been...?"
For a recovery phase, they differentiate between recovery of the canopy greening and recovery of water content in the canopy. Both are based on satellite obs only. And if a satellite image suggests greening is recovered to pre-mortality level, it might not actually be re-greening from recovered old or new young trees but could be merely dense shrubbery. The Greening parameter is often used to glean carbon stock. Shrubs have less biomass=less carbon than trees.
The water content in the canopy then somehow helps to clarify the actual recovery state. How? 
Water content in canopy always takes far longer to recover than re-greening.
Longer = years and years longer.
Always = in the 1980s as well. Which I take as: that's the normal baseline behaviour for a given biome, a given latitude zone, a given climate zone, a given elevation, a given human intervention etc.
Supplementary Fig. 5. c and d show numbers for North America and Tropics https://static-content.springer.com/esm/art%3A10.1038%2Fs41477-025-01948-4/MediaObjects/41477_2025_1948_MOESM1_ESM.pdf .
Recovery Time in years for water in canopy in North America
in the 1990s took 2 - 12, average 6.
in the 2000s took 2 - 18, average 9.
in the Tropics:
in the 1990s took 2 - 12, average 6.
in the 2000s took 2 - 11, average 7.
Europe is missing an extra whiskers plot. Maybe they saved this for their next paper. But European events are included up to 2018, if I got it right.
With all the factors to be considered, and bias in numbers of events in any given factor, making recovery comparable across regions, across biomes, across climate zones, a global average doesn't seem very useful.
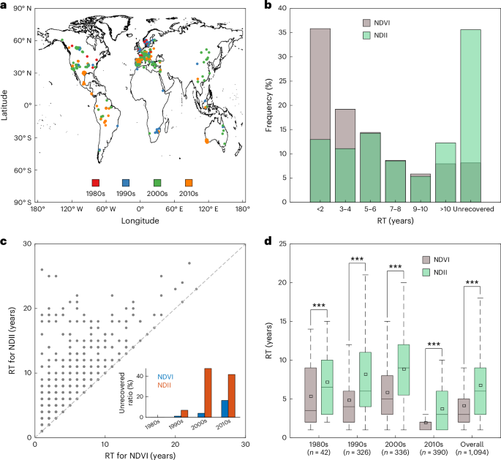
However, here are the global numbers from Figure 1d for
Recovery time RT for water in canopy. In the 1980s RT was between 2 and 15, average 8, median 6 .
In the 1990s, RT was 2 - 22, average 8, median 6.
In the 2000s, RT was 2 - 20, average 9, median 9 years.
Am curious wrt the missing potential cause for the greatly reduced RecoveryTime in the 2010s in Fig.1d. Is that an artefact of the shortened observation time for these 10 most recent mortality yrs?
And Greening recovered astonishingly quickly in the 2010s. is it the high CO2 fertilisation or a regional bias from the events in this period?


 El Paso facility will use novel purification to help ‘drought-proof’ water supply


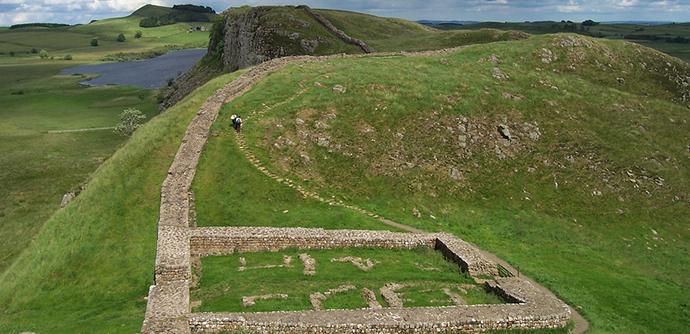
 **Extreme drought contributed to barbarian invasion of late Roman Britain, tree-ring study reveals**